Visibility
The dashboard
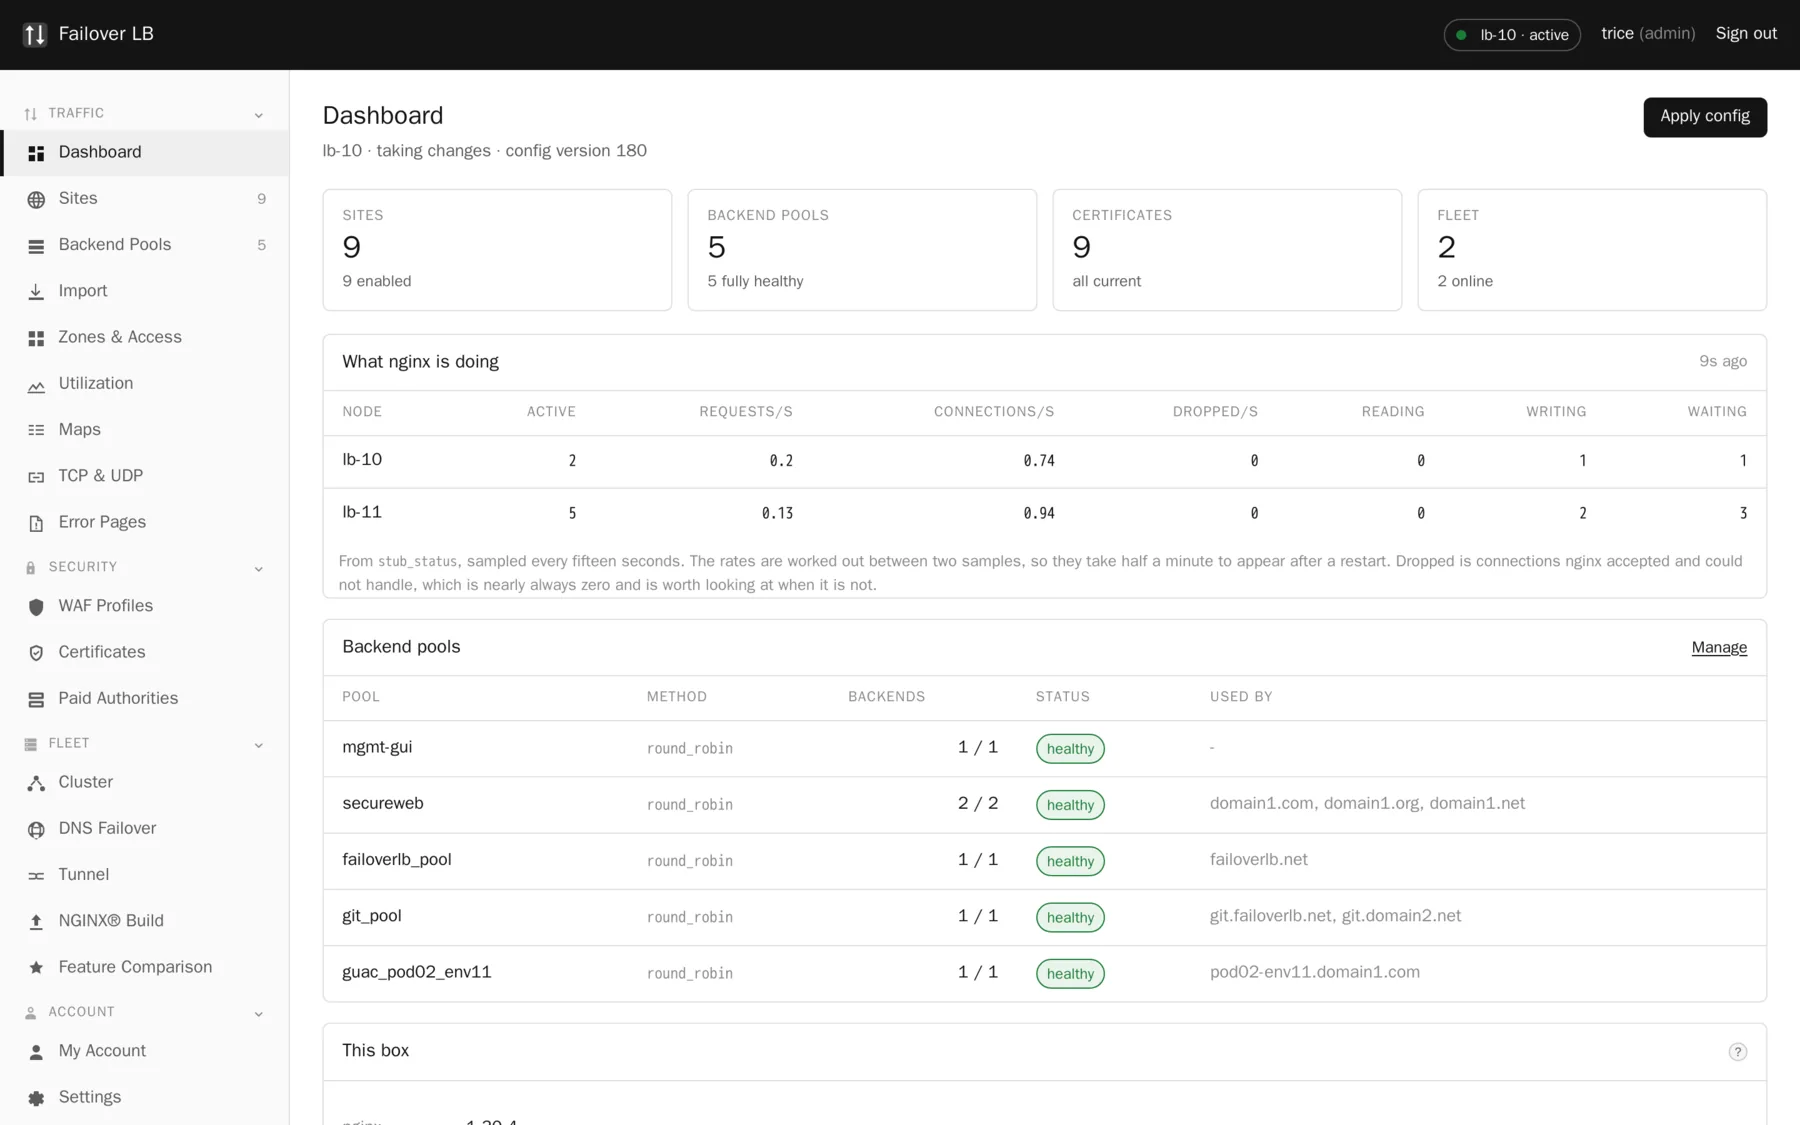
The screen you land on. It is built to answer, in one glance, whether anything needs you.
The banner that matters most
If anything is saved and not applied, there is a yellow banner at the top saying so, with the version nginx is actually running. That is the single most useful thing on the page, because "I changed it and it did not work" is nearly always "you saved it and did not apply it".
The counts
Sites, backend pools, certificates and fleet size, each with a one line summary underneath: how many are enabled, how many pools are fully healthy, whether every certificate is current, how many nodes are online. Anything that is not in a good state says so rather than showing a number you have to interpret.
What nginx is doing
One row per node: active connections, requests per second, connections per second, dropped,
reading, writing and waiting. These come from stub_status, sampled every fifteen
seconds, with rates worked out between two samples.
Dropped is the one to look at. It is connections nginx accepted and could not handle, and it is nearly always zero. When it is not, something is wrong and it is worth finding out what.
Pool health
Every pool with its balancing method, how many backends are up out of how many, and which sites use it. A pool that is partly down is visible here before anybody reports a slow site.
This box
The nginx version, the OpenSSL version with a post quantum badge when the build supports it, how many modules are compiled in, whether stream proxying works, and the current config version. It is the quickest way to confirm two nodes are running the same thing.
The top right corner
Which node you are looking at and whether it is active or standby. This matters more than it looks. Both nodes show the same screens, but changes are made on the active one. If you find a button grayed out, check here first.
Common questions
Why do the rates take a while to appear?
They are worked out between two samples fifteen seconds apart, so after a restart there is nothing to compare against for half a minute.
Does the dashboard show traffic per site?
No, stub_status is a whole server figure. Per site numbers would need log parsing, which is on the roadmap rather than in the product.
Can I see the other node's dashboard?
Yes, sign in to it directly. Each node runs the full GUI.
Step by step instructions
The how to section has searchable, task shaped answers. Search it for dashboard.